Week6 RE: De-compiling Program
According to the @CTF101: https://ctf101.org/
Reverse Engineering
Reverse Engineering in a CTF is typically the process of taking a compiled (machine code, bytecode) program and converting it back into a more human readable format.
Very often the goal of a reverse engineering challenge is to understand the functionality of a given program such that you can identify deeper issues.
- Assembly / Machine Code
- The C Programming Language
- Disassemblers
- Decompilers
Assembly/Machine Code
Machine Code or Assembly is code which has been formatted for direct execution by a CPU. Machine Code is the why readable programming languages like C, when compiled, cannot be reversed into source code (well Decompilers can sort of, but more on that later).
From Source to Compilation
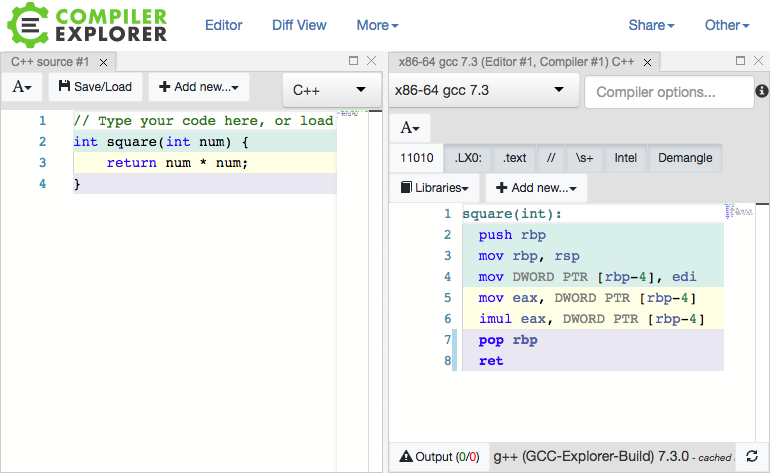
Godbolt shows the differences in machine code generated by various compilers.
For example, if we have a simple C++ function:
#include <unistd.h>
#include <stdio.h>
#include <stdlib.h>

int main() {
    char c;
    int fd = syscall(2, "/etc/passwd", 0);
    while (syscall(0, fd, &c, 1)) {
        putchar(c);
    }
}
We can see the compilation results in some verbose instrucitons for the CPU:
.LC0:
  .string "/etc/passwd"
main:
  push rbp
  mov rbp, rsp
  sub rsp, 16
  mov edx, 0
  mov esi, OFFSET FLAT:.LC0
  mov edi, 2
  mov eax, 0
  call syscall
  mov DWORD PTR [rbp-4], eax
.L3:
  lea rdx, [rbp-5]
  mov eax, DWORD PTR [rbp-4]
  mov ecx, 1
  mov esi, eax
  mov edi, 0
  mov eax, 0
  call syscall
  test rax, rax
  setne al
  test al, al
  je .L2
  movzx eax, BYTE PTR [rbp-5]
  movsx eax, al
  mov edi, eax
  call putchar
  jmp .L3
.L2:
  mov eax, 0
  leave
  ret
This is a one way process for compiled languages as there is no way to generate source from machine code. While the machine code may seem unintelligble, the extremely basic functions can be interpreted with some practice.
x86-64
x86-64 or amd64 or i64 is a 64-bit Complex Instruction Set Computing (CISC) architecture. This basically means that the registers used for this architecture extend an extra 32-bits on Intel's x86 architecture. CISC means that a single instruction can do a bunch of diferent things at once such as memory accesses, register reads, etc. It is also a variable-length instruction set which means diferent instructions can be diferent sizes ranging from 1 to 16 bytes long. And finally x86-64 allows for multi-sized register access which means that you can access certain parts of a register which are diferent sizes.
x86-64 Registers
x86-64 registers behave similarly to other architectures. A key component of x86-64 registers is multi-sized access which means the register RAX can have its lower 32 bits accessed with EAX. The next lower 16 bits can be accessed with AX and the lowest 8 bits can be accessed with AL which allows for the compuler to make optimizations which boost program execution. 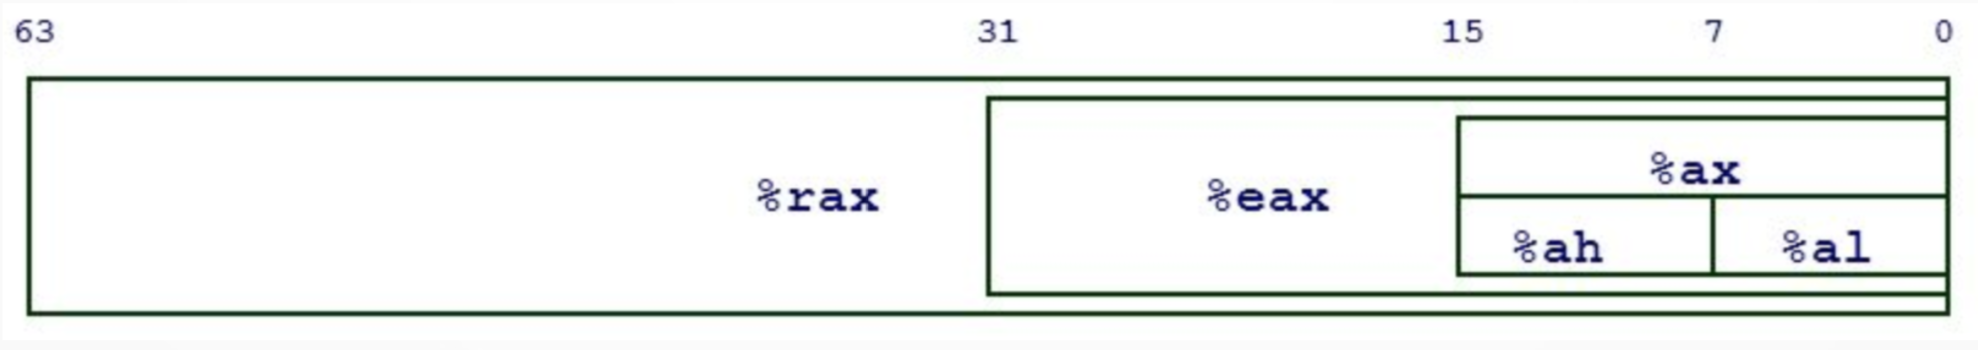
x86-64 has plenty of registers to use including rax, rbx, rcx, rdx, rdi, rsi, rsp, rip, r8-r15, and more! But some registers serve special purposes.
The special registers include: - RIP: the instruction pointer - RSP: the stack pointer - RBP: the base pointer
Instructions
An instruction represents a single operation for the CPU to perform.
There are diferent types of instructions including:
- Data movement:
mov rax, [rsp - 0x40] - Arithmetic:
add rbx, rcx - Control-flow:
jne 0x8000400
Because x86-64 is a CISC architecture, instructions can be quite complex for machine code such as repne scasb which repeats up to ECX times over memory at EDI looking for NULL byte (0x00), decrementing ECX each byte (Essentially strlen() in a single instruction!)
It is important to remember that an instruction really is just memory, this idea will become useful with Return Oriented Programming or ROP.
Note
Instructions, numbers, strings, everything! Always represented in hex.
add rax, rbx
mov rax, 0xdeadbeef
mov rax, [0xdeadbeef] == 67 48 8b 05 ef be ad de
"Hello" == 48 65 6c 6c 6f
== 48 01 d8
== 48 c7 c0 ef be ad de
Execution
What should the CPU execute? This is determined by the RIP register where IP means instruction pointer. Execution follows the pattern: fetch the instruction at the address in RIP, decode it, run it.
Examples
mov rax, 0xdeadbeef
Here the operation mov is moving the "immeadiate" 0xdeadbeef into the register RAX
mov rax, [0xdeadbeef + rbx * 4]
Here the operation mov is moving the data at the address of [0xdeadbeef + RBX*4] into the register RAX. When brackets are used, you can think of the program as getting the content from that effective address.
Example Execution
-> 0x0804000: mov eax, 0xdeadbeef            Register Values:
   0x0804005: mov ebx, 0x1234                RIP = 0x0804000
   0x080400a: add, rax, rbx                  RAX = 0x0
   0x080400d: inc rbx                        RBX = 0x0
   0x0804010: sub rax, rbx                   RCX = 0x0
   0x0804013: mov rcx, rax                   RDX = 0x0
   0x0804000: mov eax, 0xdeadbeef            Register Values:
-> 0x0804005: mov ebx, 0x1234                RIP = 0x0804005
   0x080400a: add, rax, rbx                  RAX = 0xdeadbeef
   0x080400d: inc rbx                        RBX = 0x0
   0x0804010: sub rax, rbx                   RCX = 0x0
   0x0804013: mov rcx, rax                   RDX = 0x0
   0x0804000: mov eax, 0xdeadbeef            Register Values:
   0x0804005: mov ebx, 0x1234                RIP = 0x080400a
-> 0x080400a: add, rax, rbx                  RAX = 0xdeadbeef
   0x080400d: inc rbx                        RBX = 0x1234
   0x0804010: sub rax, rbx                   RCX = 0x0
   0x0804013: mov rcx, rax                   RDX = 0x0
   0x0804000: mov eax, 0xdeadbeef            Register Values:
   0x0804005: mov ebx, 0x1234                RIP = 0x080400d
   0x080400a: add, rax, rbx                  RAX = 0xdeadd123
-> 0x080400d: inc rbx                        RBX = 0x1234
   0x0804010: sub rax, rbx                   RCX = 0x0
   0x0804013: mov rcx, rax                   RDX = 0x0
   0x0804000: mov eax, 0xdeadbeef            Register Values:
   0x0804005: mov ebx, 0x1234                RIP = 0x0804010
   0x080400a: add, rax, rbx                  RAX = 0xdeadd123
   0x080400d: inc rbx                        RBX = 0x1235
-> 0x0804010: sub rax, rbx                   RCX = 0x0
   0x0804013: mov rcx, rax                   RDX = 0x0
   0x0804000: mov eax, 0xdeadbeef            Register Values:
   0x0804005: mov ebx, 0x1234                RIP = 0x0804013
   0x080400a: add, rax, rbx                  RAX = 0xdeadbeee
   0x080400d: inc rbx                        RBX = 0x1235
   0x0804010: sub rax, rbx                   RCX = 0x0
-> 0x0804013: mov rcx, rax                   RDX = 0x0
   0x0804000: mov eax, 0xdeadbeef            Register Values:
   0x0804005: mov ebx, 0x1234                RIP = 0x0804005
   0x080400a: add, rax, rbx                  RAX = 0xdeadbeee
   0x080400d: inc rbx                        RBX = 0x1235
   0x0804010: sub rax, rbx                   RCX = 0xdeadbeee
   0x0804013: mov rcx, rax                   RDX = 0x0
Control Flow
How can we express conditionals in x86-64? We use conditional jumps such as:
jnz <address>je <address>jge <address>jle <address>- etc.
They jump if their condition is true, and just go to the next instruction otherwise. These conditionals are checking EFLAGS which are special registers which store flags on certain instructions such as add rax, rbx which sets the o (overflow) flag if the sum is greater than a 64-bit register can hold, and wraps around. You can jump based on that with a jo instruction. The most important thing to remember is the cmp instruction:
cmp rax, rbx
jle error
This assembly jumps if RAX <= RBX
Addresses
Memory acts similarly to a big array where the indices of this "array" are memory addresses. Remember from earlier:
mov rax, [0xdeadbeef]
The square brackets mean "get the data at this address". This is analagous to the C/C++ syntax: rax = *0xdeadbeef;
The C Programming Language
History
The C programming language iwas written by Dennis Ritchie in the 1970s while he was working at Bell Labs. It was first used to reimplement the Unix operating system which was purely written in assembly language. At first, the Unix developers were considering using a language called "B" but because B wasn't optimized for the target computer, the C language was created.
C is the letter and the programming language after B!
C was designed to be close to assembly and is still widely used in lower level programming where speed and control are needed (operating systems, embedded systems). C was also very influential to other programming langauges used today. Notable languages include C++, Objective-C, Golang, Java, JavaScript, PHP, Python, and Rust.
Hello World
C is an ancestor of many other programming languages and if you are familiar with programming, it's likely that C will be at least someewhat familiar.
#include <stdio.h>
int main()
{
   printf("Hello, World!");
   return 0;
}
Today
Today C is widely used either as a low level programming langauge or is the base language that other programming languages are implemented in.
While it can be difficult to see, the C language compiles down directly into machine code. The compiler is programmed to process the provided C code and emit assembly that's targetted to whatever operating system and architecture the compiler is set to use.
Some common compilers include:
- gcc
- clang
A good way to explore this relationship is to use this online GCC Explorer from Matt Godbolt.
In regards to CTF, many reverse engineering and exploitation CTF challenges are written in C because the language compiles down directly to assembly and there are little to no safeguards in the language. This means developers must manually handle both. Of course, this can lead to mistakes which can sometimes lead to security issues.
Other higher level langauges like Python manage memory and garbage collection for you. Google Golang was inspired by C but adds in functionality like garbage collection, and memory safety.
There are some examples of famously vulnerable functions in C which are still available and can still result in vulnerabilities:
gets- Can result in buffer overflowsstrcpy- Can result in buffer overflowsstrcat- Can result in buffer overflowsstrcmp- Can result in timing attacks
Types
C has four basic types:
- char - characters
- int - integers (e.g. 125)
- float - 32 bit floating point number (e.g. 2.4)
- double - 64 bit floating point number (like a float but more precise in terms of decimal points)
Pointers
C uses an idea known as pointers. A pointer is a variable which contains the address of another variable.
To understand this idea we should first understand that memory is laid out in terms of addresses and data gets stored at these addresses.
Take the following example of defining an integer in C:
int x = 4;
To the programmer this is the variable x receiving the value of 4. The computer stores this value in some location in memory. For example we can say that address 0x1000 now holds the value 4. The computer knows to directly access the memory and retrieve the value 4 whenever the programmer tries to use the x variable. If we were to say x + 4, the computer would give you 8 instead of 0x1004.
But in C we can retrieve the memory address being used to hold the 4 value (i.e. 0x1000) by using the & character and using * to create an "integer pointer" type.
int* y = &x;
The y variable will store the address pointed to by the xvariable (0x1000).
The * character allows us to declare pointer variables but also allows us to access the value stored at a pointer. For example, entering *y allows us to access the 4 value instead of 0x1000.
Whenever we use the y variable we are using the memory address, but if we use the x variable we use the value stored at the memory address.
Arrays
Arrays are a grouping of objects of the same type. They are typically created with the following syntax:
type arrayName [ arraySize ];
To initialize values in the array we can do:
int integers[ 10 ] = {1, 2, 3, 4, 5, 6, 7, 8, 9, 10};
Arrays allow programmers to group data into logical containers.
To access the indiviual elements of an array we access the contents by their "index". Most programming langauges today start counting from 0. So to take our previous example:
int integers[ 10 ] = {1, 2, 3, 4, 5, 6, 7, 8, 9, 10};
/*     indexes        0  1  2  3  4  5  6  7  8   9
To access the value 6 we would use index 5:
integers[5];
How do arrays work?
Arrays are a clever combination of multiplication, pointers, and programming.
Because the computer knows the data type used for every element in the array, the computer needs to simply multiply the size of the data type by the index you are looking for and then add this value to the address of the beginning of the array.
For example if we know that the base address of an array is 1000 and we know that each integer takes 8 bytes, we know that if we have 8 integers right next to each other, we can get the integer at the 4th index with the following math:
1000 + (4 * 8) =  1032
array [ 1   , 2   , 3   , 4   , 5   , 6   , 7   , 8   ]
index   0     1     2     3     4     5     6     7
addrs  1000  1008  1016  1024  1032  1040  1048  1056
Disassemblers
A disassembler is a tool which breaks down a compiled program into machine code.
List of Disassemblers
- IDA
- Binary Ninja
- GNU Debugger (GDB)
- radare2
- Hopper
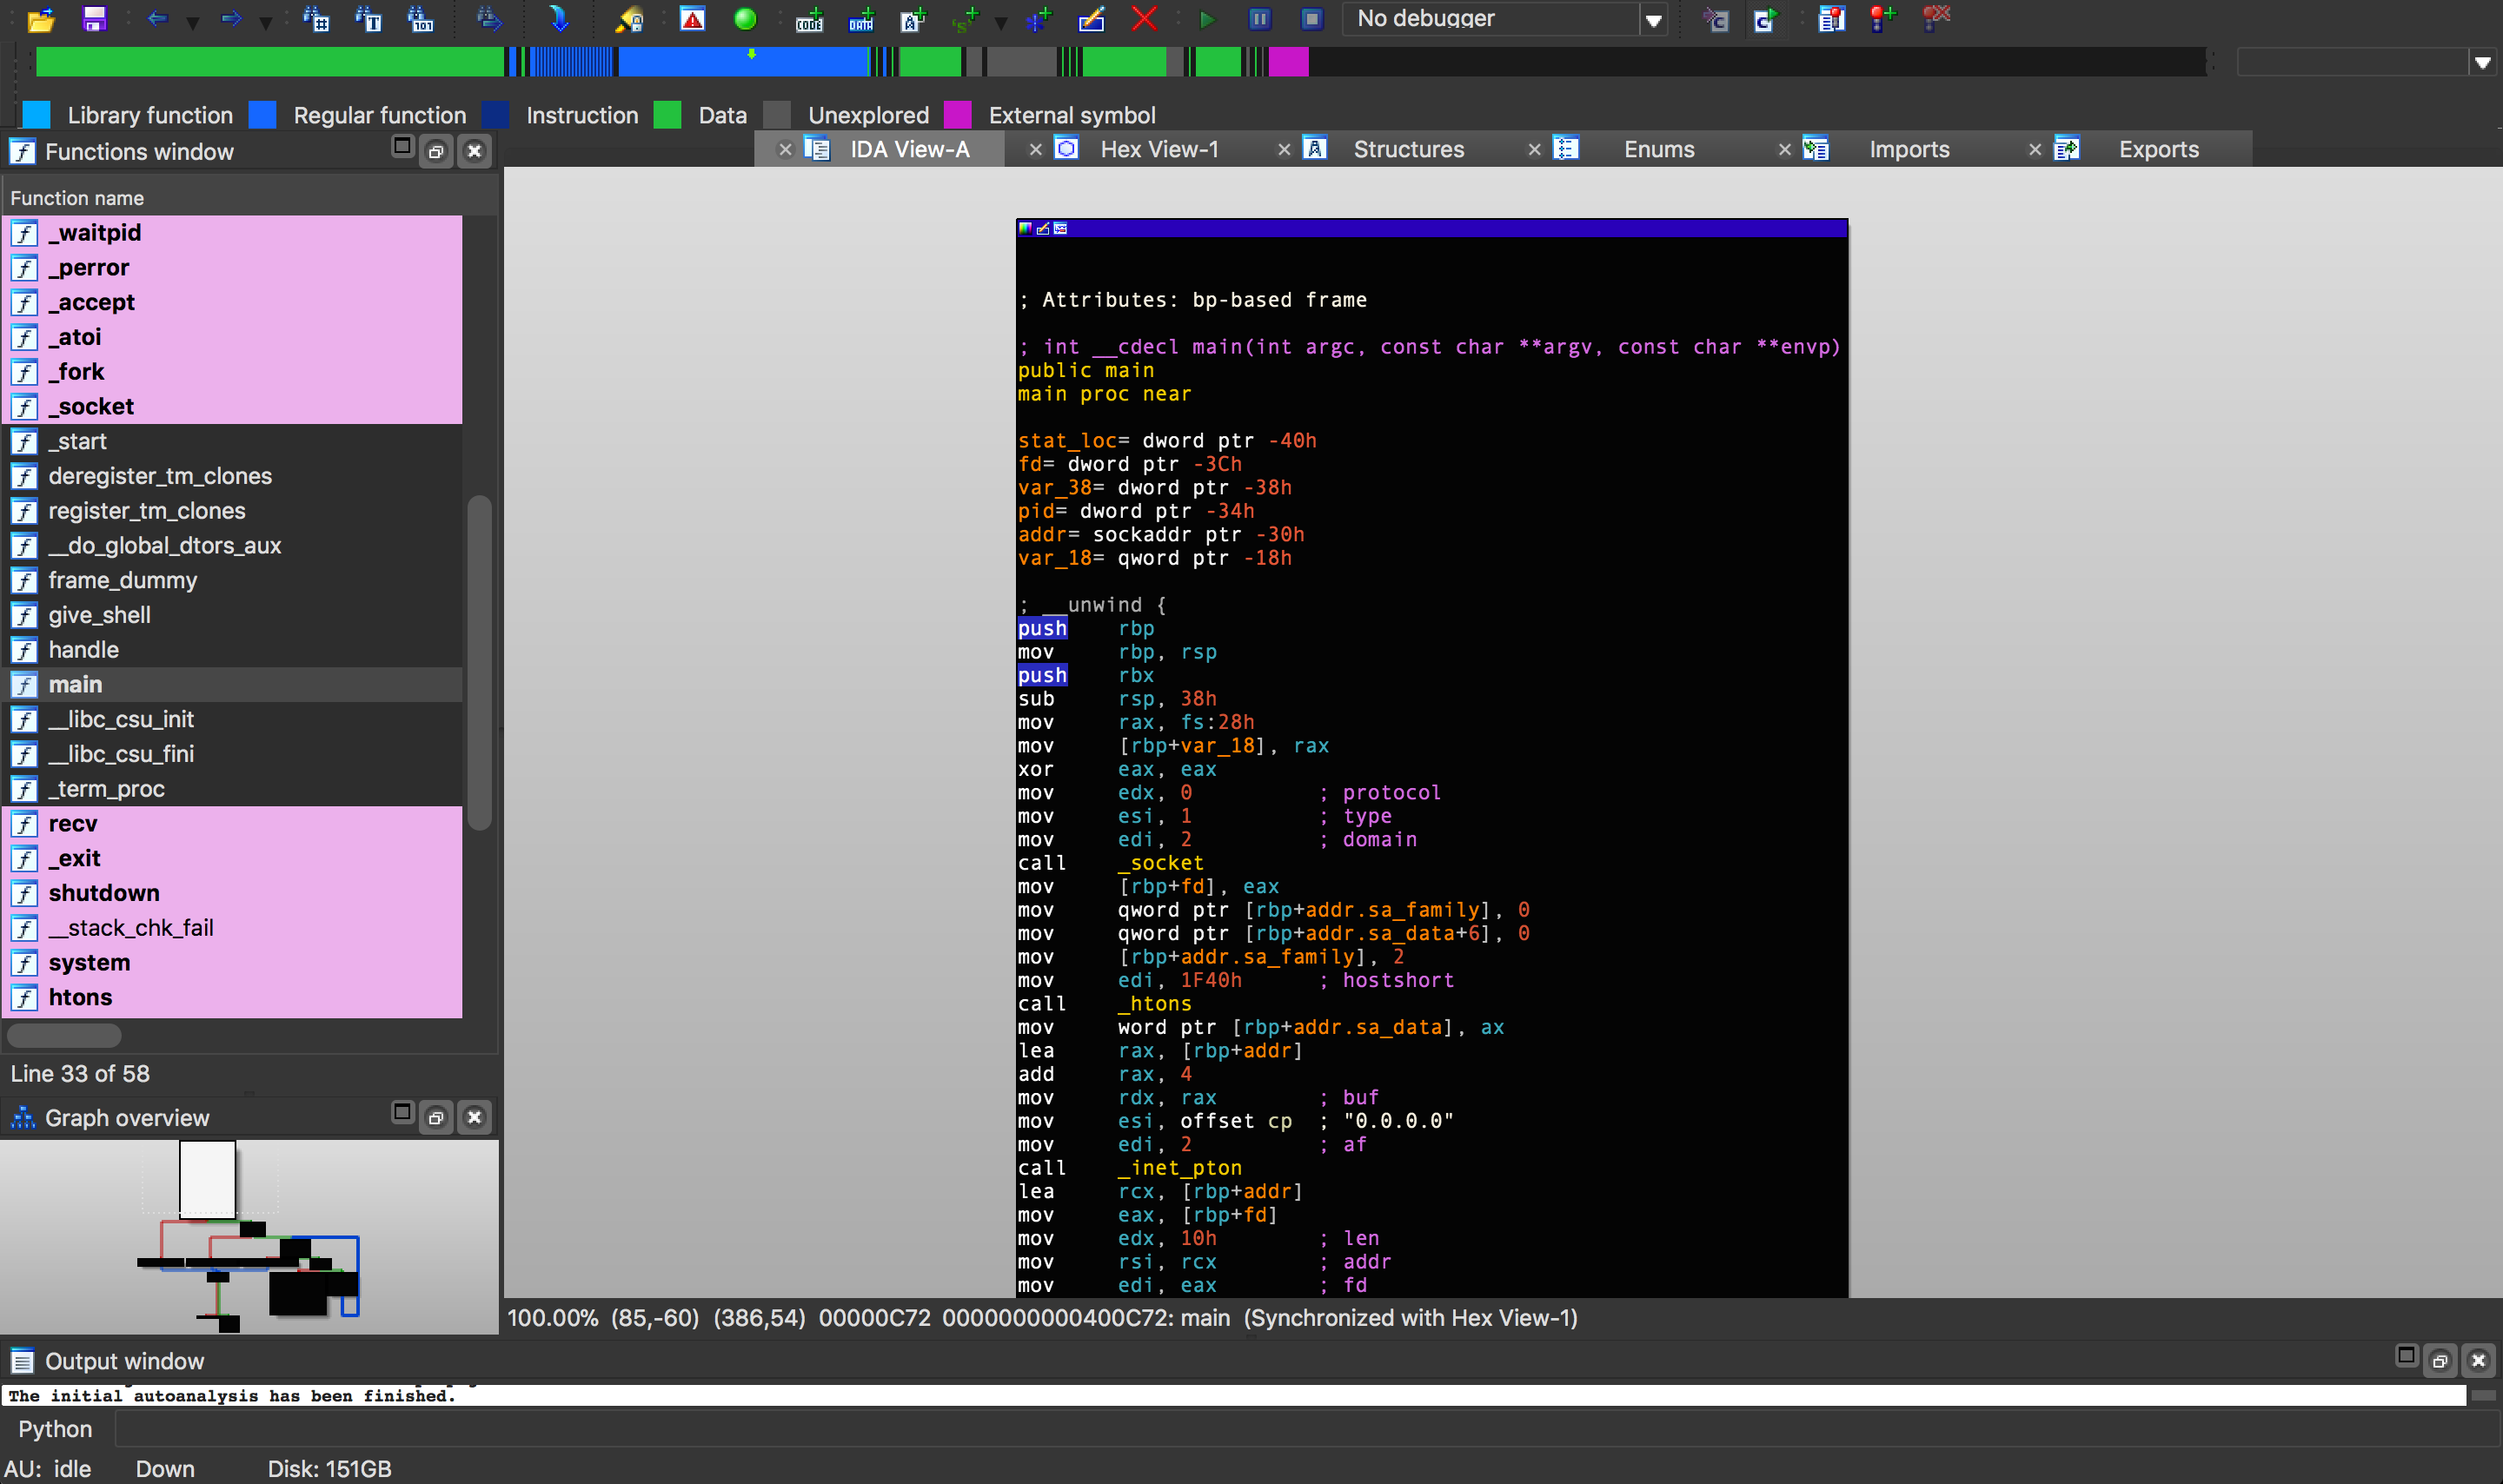
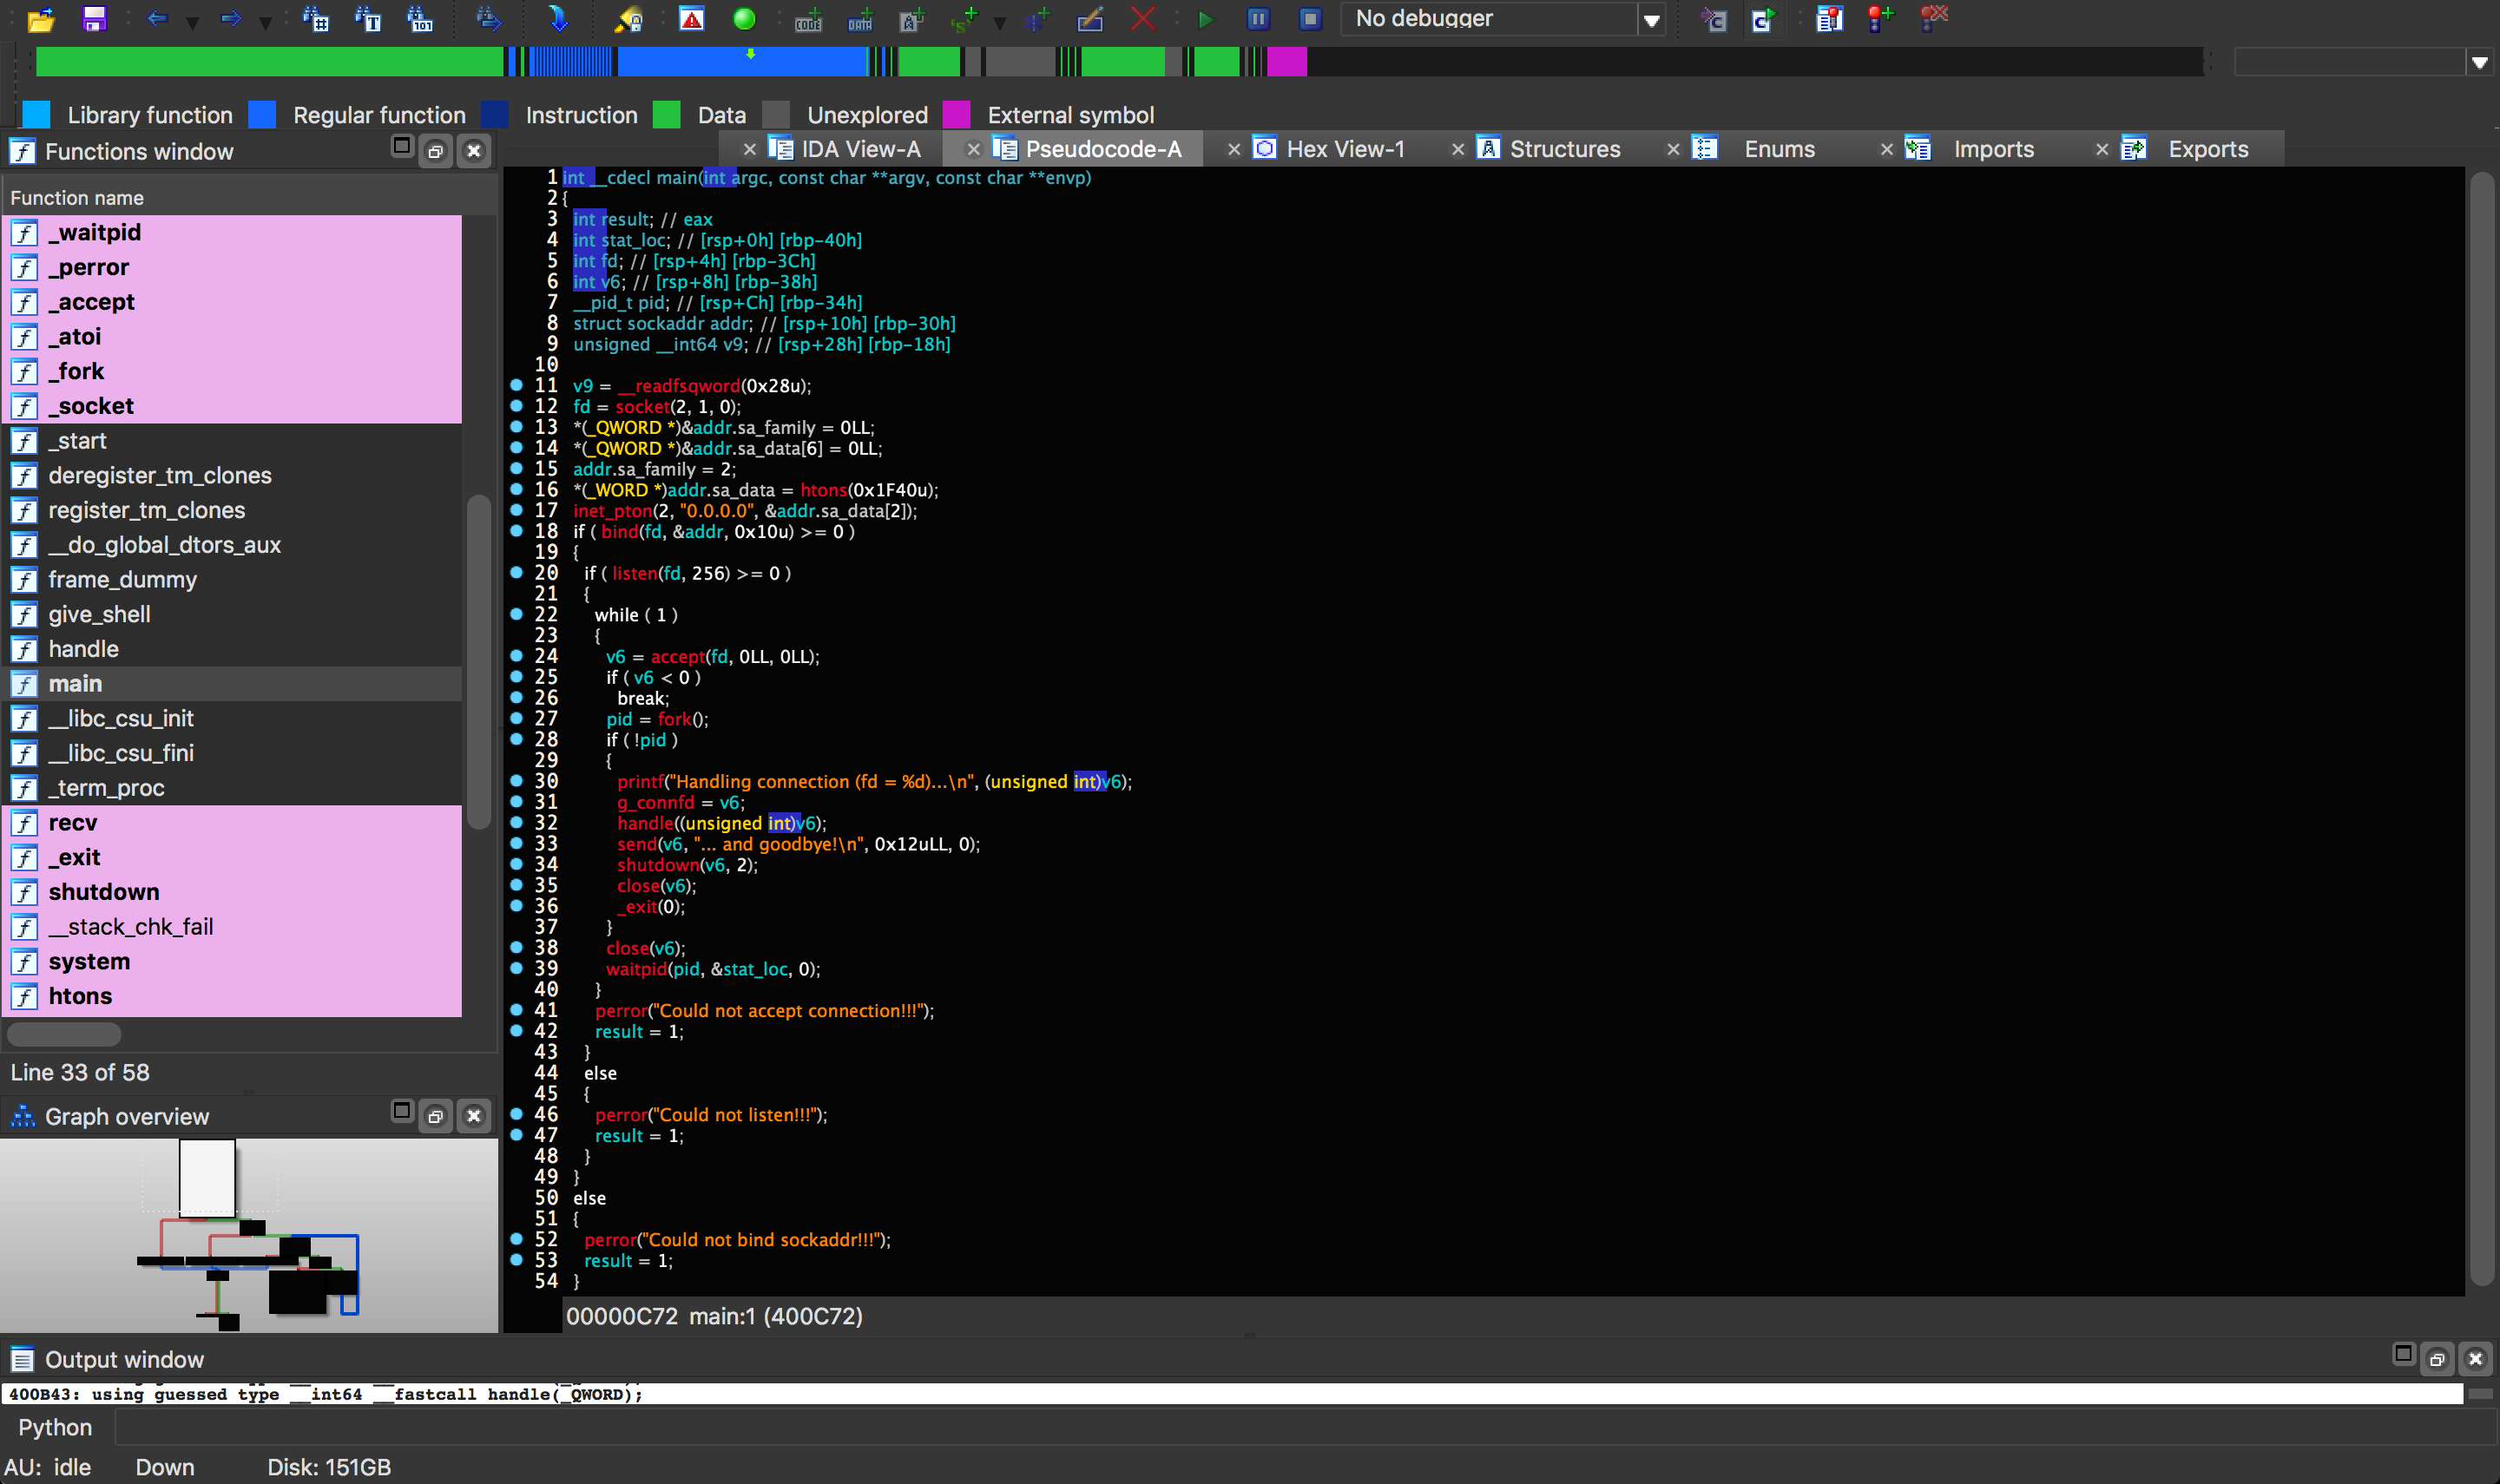
IDA
The Interactive Disassembler (IDA) is the industry standard for binary disassembly. IDA is capable of disassembling "virtually any popular file format". This makes it very useful to security researchers and CTF players who often need to analyze obscure files without knowing what they are or where they came from. IDA also features the industry leading Hex Rays decompiler which can convert assembly code back into a pseudo code like format.
IDA also has a plugin interface which has been used to create some successful plugins that can make reverse engineering easier:
- https://github.com/google/binnavi
- https://github.com/yegord/snowman
- https://github.com/gaasedelen/lighthouse
- https://github.com/joxeankoret/diaphora
- https://github.com/REhints/HexRaysCodeXplorer
- https://github.com/osirislab/Fentanyl
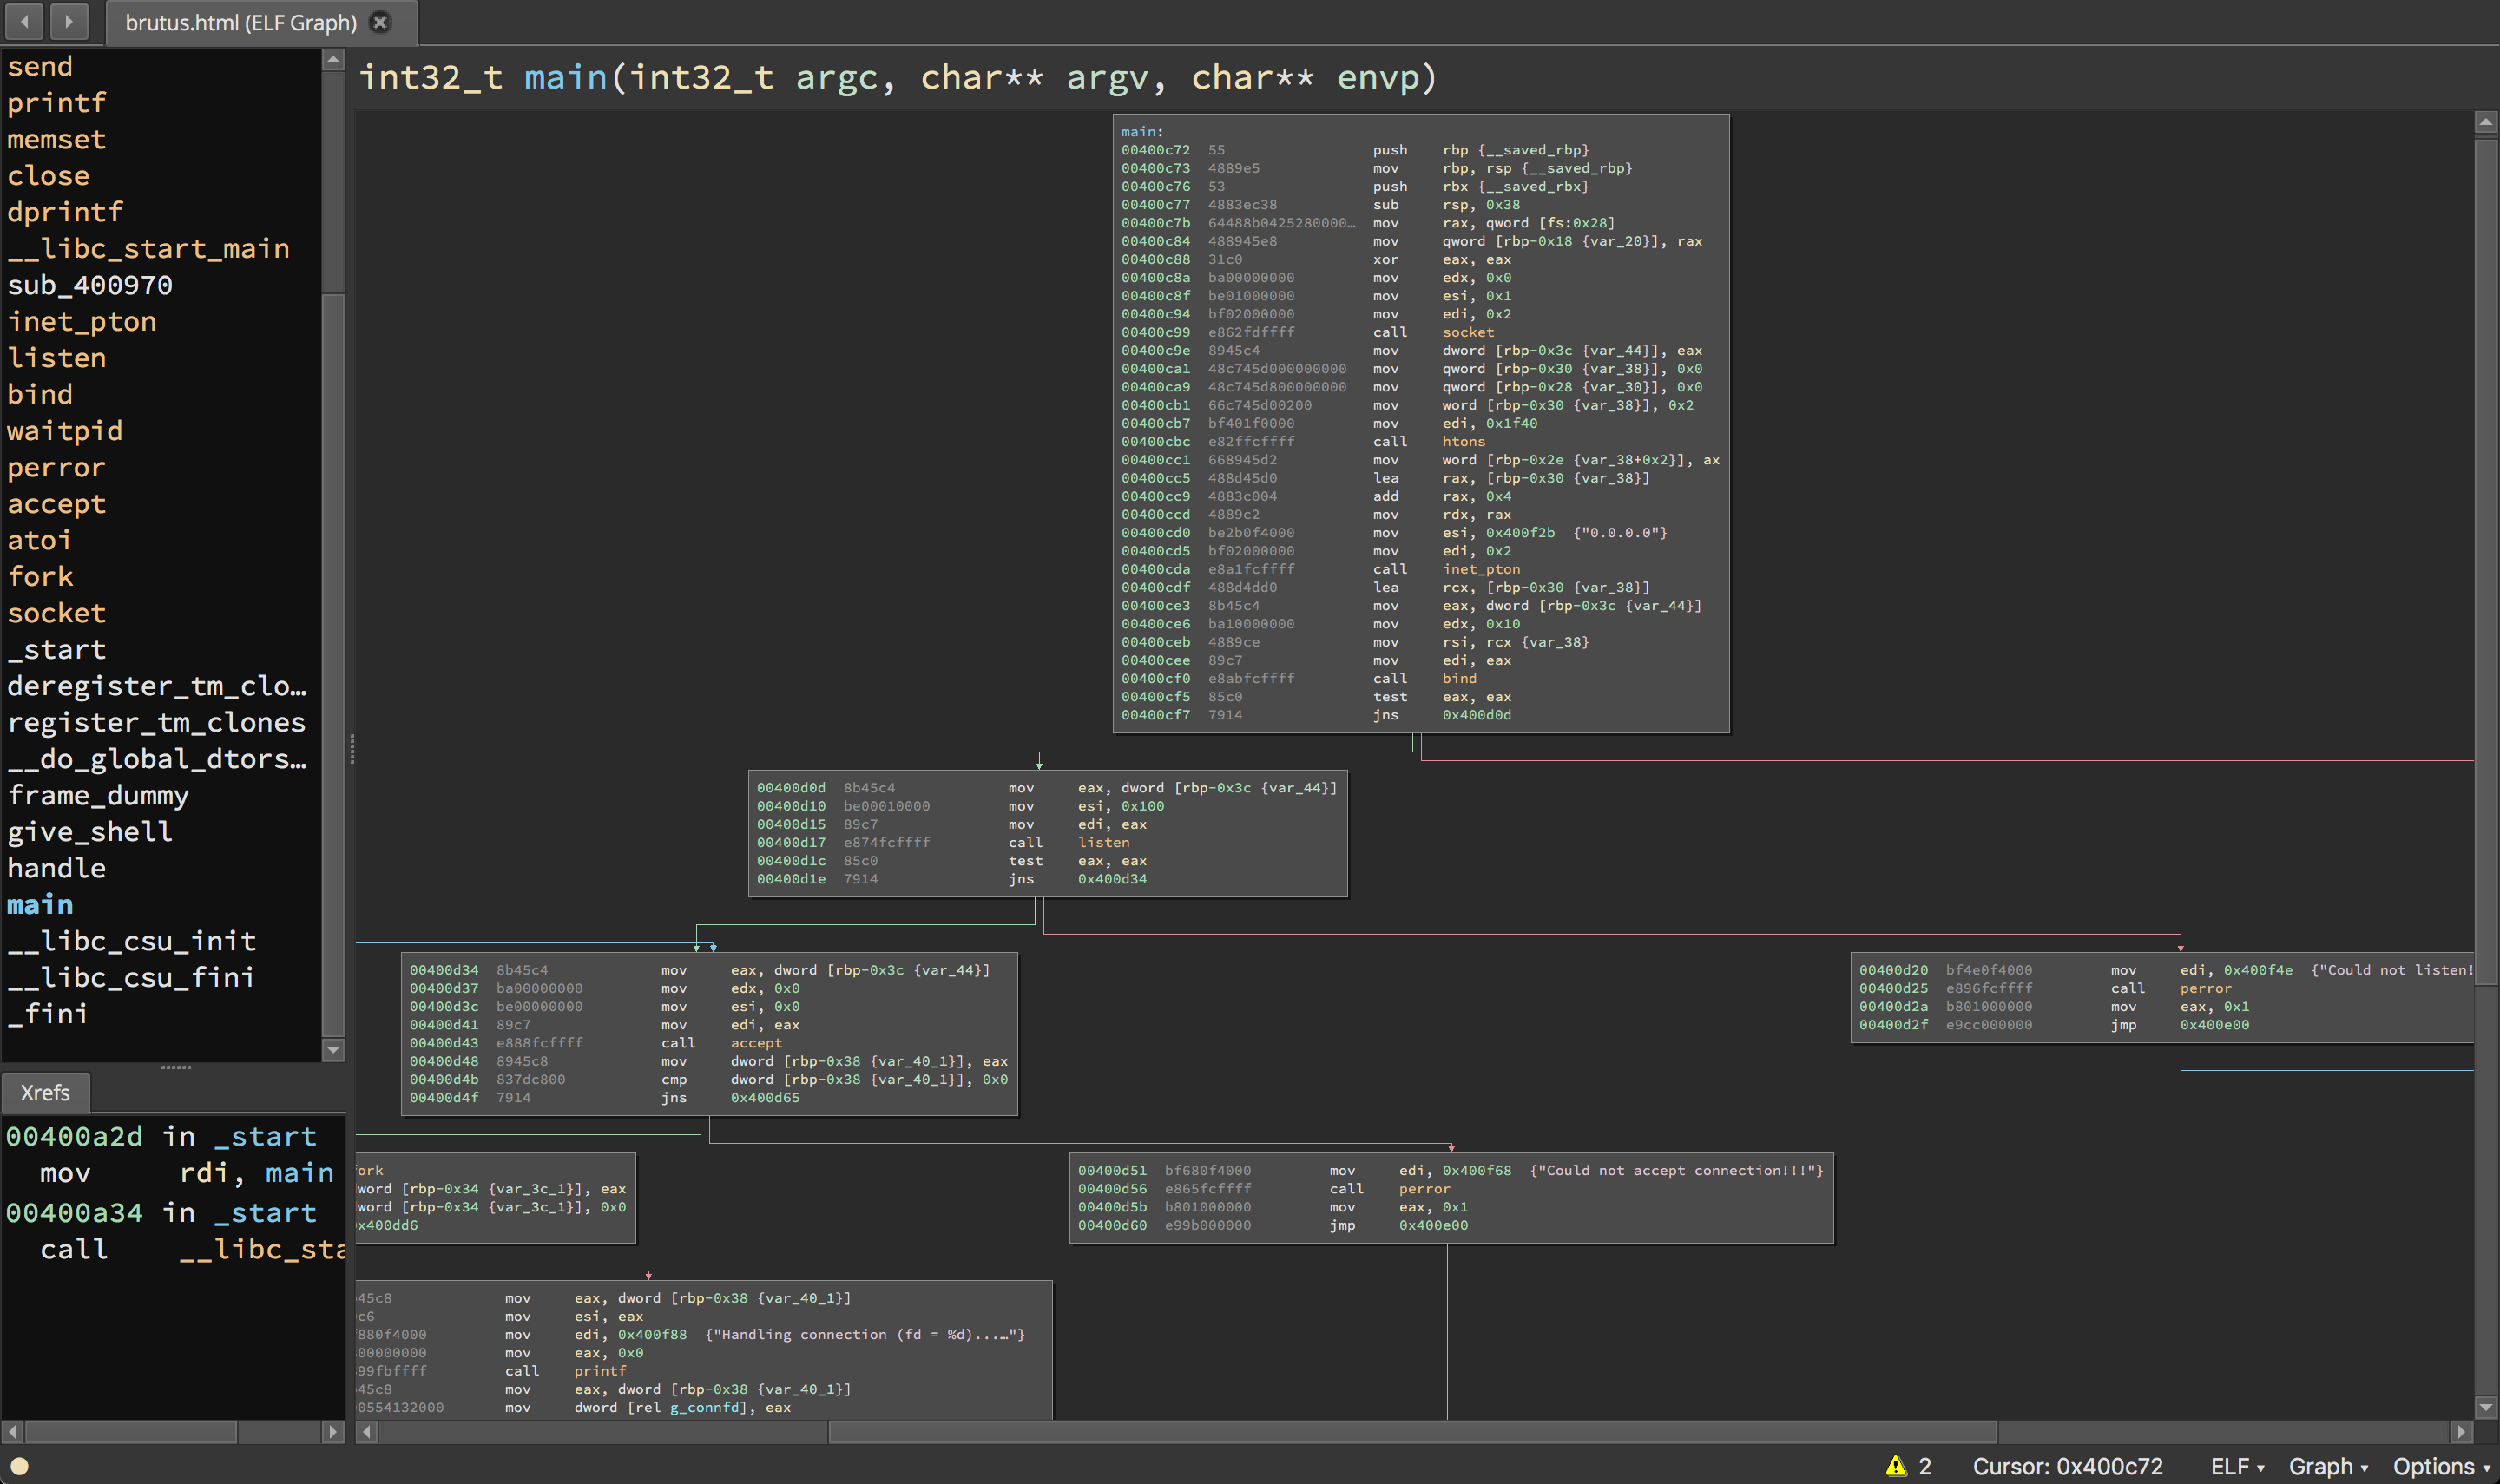
Binary Ninja
Binary Ninja is an up and coming disassembler that attempts to bring a new, more programmatic approach to reverse engineering. Binary Ninja brings an improved plugin API and modern features to reverse engineering. While it's less popular or as old as IDA, Binary Ninja (often called binja) is quickly gaining ground and has a small community of dedicated users and followers.
Binja also has some community contributed plugins which are collected here: https://github.com/Vector35/community-plugins
gdb
The GNU Debugger is a free and open source debugger which also disassembles programs. It's capable as a disassembler, but most notably it is used by CTF players for its debugging and dynamic analysis capabailities.
gdb is often used in tandom with enhancement scripts like peda, pwndbg, and GEF
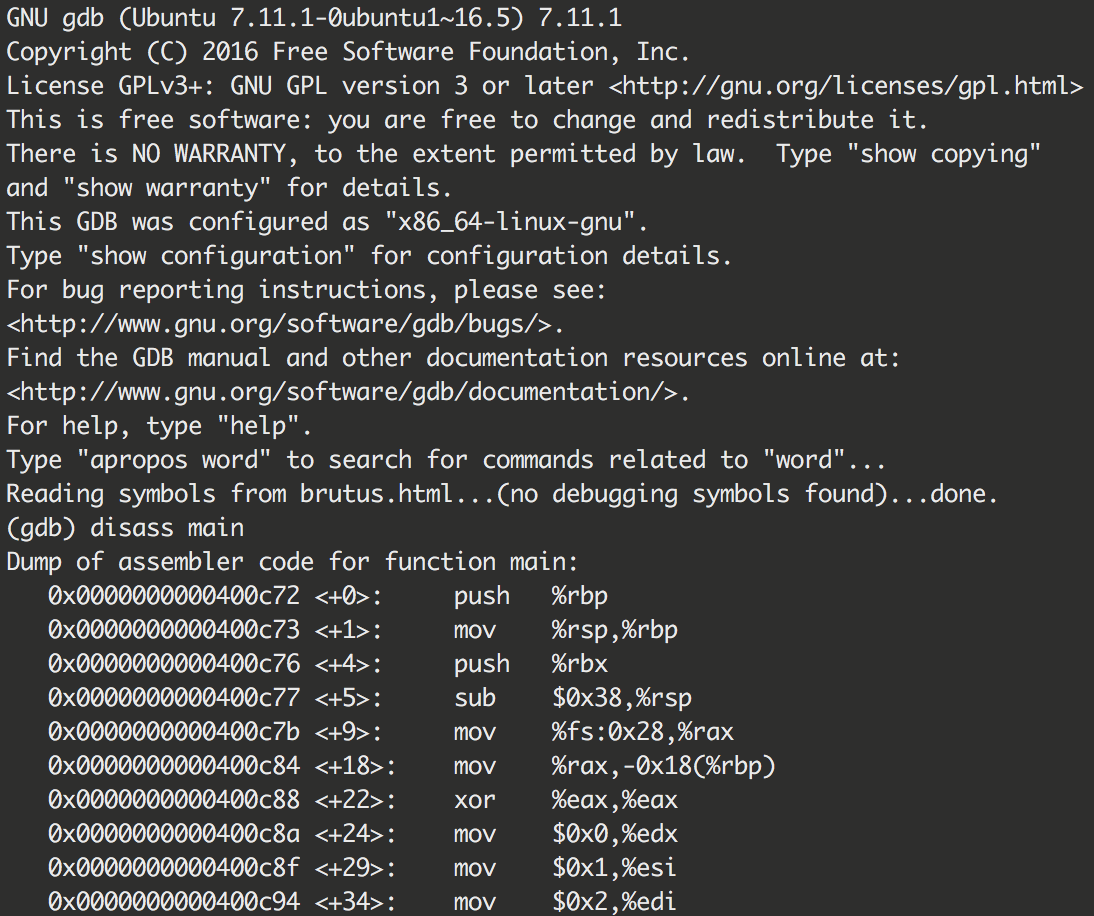
The GNU Debugger (GDB)
The GNU Debugger or GDB is a powerful debugger which allows for step-by-step execution of a program. It can be used to trace program execution and is an important part of any reverse engineering toolkit.
Vanilla GDB
GDB without any modifications is unintuitive and obscures a lot of useful information. The plug-in pwndb solves a lot of these problems and makes for a much more pleasant experience. But if you are constrained and have to use vanilla gdb, here are several things to make your life easier.
Starting GDB
To execute GBD and attach it to a program simply run gdb [program]
Disassembly
(gdb) disassemble [address/symbol] will display the disassembly for that function/frame
GDB will autocomplete functions, so saying (gdb) disas main suffices if you'd like to see the disassembly of main
View Disassembly During Execution
Another handy thing to see while stepping through a program is the disassembly of nearby instructions:
(gdb) display/[# of instructions]i $pc [± offset]
displayshows data with each step/[#]ishows how much data in the format i for instruction$pcmeans the pc, program counter, register[± offset]allows you to specify how you would like the data offset from the current instruction
Example Usage
(gdb) display/10i $pc - 0x5
This command will show 10 instructions on screen with an offset from the next instruction of 5, giving us this display:
   0x8048535 <main+6>:  lock pushl -0x4(%ecx)
   0x8048539 <main+10>: push   %ebp
=> 0x804853a <main+11>: mov    %esp,%ebp
   0x804853c <main+13>: push   %ecx
   0x804853d <main+14>: sub    $0x14,%esp
   0x8048540 <main+17>: sub    $0xc,%esp
   0x8048543 <main+20>: push   $0x400
   0x8048548 <main+25>: call   0x80483a0 <malloc@plt>
   0x804854d <main+30>: add    $0x10,%esp
   0x8048550 <main+33>: sub    $0xc,%esp
Deleting Views
If for whatever reason, a view no long suits your needs simply call (gdb) info display which will give you a list of active displays:
Auto-display expressions now in effect:
Num Enb Expression
1:   y  /10bi $pc-0x5
Then simply execute (gdb) delete display 1 and your execution will resume without the display.
Registers
In order to view the state of registers with vanilla gdb, you need to run the command info registers which will display the state of all the registers:
eax            0xf77a6ddc   -142971428
ecx            0xffe06b10   -2069744
edx            0xffe06b34   -2069708
ebx            0x0  0
esp            0xffe06af8   0xffe06af8
ebp            0x0  0x0
esi            0xf77a5000   -142979072
edi            0xf77a5000   -142979072
eip            0x804853a    0x804853a <main+11>
eflags         0x286    [ PF SF IF ]
cs             0x23 35
ss             0x2b 43
ds             0x2b 43
es             0x2b 43
fs             0x0  0
gs             0x63 99
If you simply would like to see the contents of a single register, the notation x/x $[register] where:
x/xmeans display the address in hex notation$[register]is the register code such as eax, rax, etc.
Pwndbg
These commands work with vanilla gdb as well.
Setting Breakpoints
Setting breakpoints in GDB uses the format b*[Address/Symbol]
Example Usage
(gdb) b*main: Break at the start(gdb) b*0x804854d: Break at 0x804854d(gdb) b*0x804854d-0x100: Break at 0x804844d
Deleting Breakpoints
As before, in order to delete a view, you can list the available breakpoints using (gdb) info breakpoints (don't forget about GDB's autocomplete, you don't always need to type out every command!) which will display all breakpoints:
Num     Type           Disp Enb Address    What
1       breakpoint     keep y   0x0804852f <main>
3       breakpoint     keep y   0x0804864d <__libc_csu_init+61>
Then simply execute (gdb) delete 1
Note
GDB creates breakpoints chronologically and does NOT reuse numbers.
Stepping
What good is a debugger if you can't control where you are going? In order to begin execution of a program, use the command r [arguments] similar to how if you ran it with dot-slash notation you would execute it ./program [arguments]. In this case the program will run normally and if no breakpoints are set, you will execute normally. If you have breakpoints set, you will stop at that instruction.
(gdb) continue [# of breakpoints]: Resumes the execution of the program until it finishes or until another breakpoint is hit (shorthandc)(gdb) step[# of instructions]: Steps into an instruction the specified number of times, default is 1 (shorthands)(gdb) next instruction [# of instructions]: Steps over an instruction meaning it will not delve into called functions (shorthandni)(gdb) finish: Finishes a function and breaks after it gets returned (shorthandfin)
Examining
Examining data in GDB is also very useful for seeing how the program is affecting data. The notation may seem complex at first, but it is flexible and provides powerful functionality.
(gdb) x/[#][size][format] [Address/Symbol/Register][± offset]
x/means examine[#]means how much[size]means what size the data should be such as a word w (2 bytes), double word d (4 bytes), or giant word g (8 bytes)[format]means how the data should be interpreted such as an instruction i, a string s, hex bytes x[Address/Symbol][± offset]means where to start interpreting the data
Example Usage
(gdb) x/x $rax: Displays the content of the register RAX as hex bytes(gdb) x/i 0xdeadbeef: Displays the instruction at address 0xdeadbeef(gdb) x/10s 0x893e10: Displays 10 strings at the address(gdb) x/10gx 0x7fe10: Displays 10 giant words as hex at the address
Forking
If the program happens to be an accept-and-fork server, gdb will have issues following the child or parent processes. In order to specify how you want gdb to function you can use the command set follow-fork-mode [on/off]
Setting Data
If you would like to set data at any point, it is possible using the command set [Address/Register]=[Hex Data]
Example Usage
set $rax=0x0: Sets the register rax to 0set 0x1e4a70=0x123: Sets the data at 0x1e4a70 to 0x123
Process Mapping
A handy way to find the process's mapped address spaces is to use info proc map:
Mapped address spaces:

    Start Addr   End Addr       Size     Offset objfile
     0x8048000  0x8049000     0x1000        0x0 /directory/program
     0x8049000  0x804a000     0x1000        0x0 /directory/program
     0x804a000  0x804b000     0x1000     0x1000 /directory/program
    0xf75cb000 0xf75cc000     0x1000        0x0
    0xf75cc000 0xf7779000   0x1ad000        0x0 /lib32/libc-2.23.so
    0xf7779000 0xf777b000     0x2000   0x1ac000 /lib32/libc-2.23.so
    0xf777b000 0xf777c000     0x1000   0x1ae000 /lib32/libc-2.23.so
    0xf777c000 0xf7780000     0x4000        0x0
    0xf778b000 0xf778d000     0x2000        0x0 [vvar]
    0xf778d000 0xf778f000     0x2000        0x0 [vdso]
    0xf778f000 0xf77b1000    0x22000        0x0 /lib32/ld-2.23.so
    0xf77b1000 0xf77b2000     0x1000        0x0
    0xf77b2000 0xf77b3000     0x1000    0x22000 /lib32/ld-2.23.so
    0xf77b3000 0xf77b4000     0x1000    0x23000 /lib32/ld-2.23.so
    0xffc59000 0xffc7a000    0x21000        0x0 [stack]
This will show you where the stack, heap (if there is one), and libc are located.
Attaching Processes
Another useful feature of GDB is to attach to processes which are already running. Simply launch gdb using gdb, then find the process id of the program you would like to attach to an execute attach [pid].
Decompilers
Decompilers do the impossible and reverse compiled code back into psuedocode/code.
IDA offers HexRays, which translates machine code into a higher language pseudocode.
Example Workflow
Let's say we are disassembling a program which has the source code:
#include <stdio.h>

void printSpacer(int num){
    for(int i = 0; i < num; ++i){
        printf("-");
    }
    printf("\n");
}

int main()
{
    char* string = "Hello, World!";
    for(int i = 0; i < 13; ++i){
        printf("%c", string[i]);
        for(int j = i+1; j < 13; j++){
            printf("%c", string[j]);
        }
        printf("\n");
        printSpacer(13 - i);
    }
    return 0;
}
And creates an output of:
Hello, World!
-------------
ello, World!
------------
llo, World!
-----------
lo, World!
----------
o, World!
---------
, World!
--------
 World!
-------
World!
------
orld!
-----
rld!
----
ld!
---
d!
--
!
-
If we are given a binary compiled from that source and we want to figure out how the source looks, we can use a decompiler to get c pseudocode which we can then use to reconstruct the function. The sample decompilation can look like:
printSpacer:
int __fastcall printSpacer(int a1)
{
  int i; // [rsp+8h] [rbp-8h]

  for ( i = 0; i < a1; ++i )
    printf("-");
  return printf("\n");
}

main:
int __cdecl main(int argc, const char **argv, const char **envp)
{
  int v4; // [rsp+18h] [rbp-18h]
  signed int i; // [rsp+1Ch] [rbp-14h]

  for ( i = 0; i < 13; ++i )
  {
    v4 = i + 1;
    printf("%c", (unsigned int)aHelloWorld[i], envp);
    while ( v4 < 13 )
      printf("%c", (unsigned int)aHelloWorld[v4++]);
    printf("\n");
    printSpacer(13 - i);
  }
  return 0;
}
A good method of getting a good representation of the source is to convert the decompilation into Python since Python is basically psuedocode that runs. Starting with main often allows you to gain a good overview of what the program is doing and will help you translate the other functions.
Main
We know we will start with a main function and some variables, if you trace the execution of the variables, you can oftentimes determine the variable type. Because i is being used as an index, we know its an int, and because v4 used as one later on, it too is an index. We can also see that we have a variable aHelloWorld being printed with "%c", we can determine it represents the 'Hello, World!' string. Lets define all these variables in our Python main function:
def main():
    string = "Hello, World!"
    i = 0
    v4 = 0
    for i in range(0, 13):
        v4 = i + 1
        print(string[i], end='')
        while v4 < 13:
            print(string[v4], end='')
            v4 += 1
        print()
        printSpacer(13-i)
printSpacer Function
Now we can see that printSpacer is clearly being fed an int value. Translating it into python shouldn't be too hard.
def printSpacer(number):
    i = 0
    for i in range(0, number):
        print("-", end='')
    print()
Results
Running main() gives us:
Hello, World!
-------------
ello, World!
------------
llo, World!
-----------
lo, World!
----------
o, World!
---------
, World!
--------
 World!
-------
World!
------
orld!
-----
rld!
----
ld!
---
d!
--
!
-
Exercise
(4 pt) De-Android
Android source code is easy to de-compile. Rather than reading assembly codes from the beginning, why not try some java first?
Try to reverse this Android apk file and find flag in it.
Flag format: CTFlearn{******}
Hint1: if you really have difficult to reverse Android, I would recommend you to try jadx.
Hint2: md5 is old and not safe. So many methods can help you to crack md5.
(4 pt) Touhou Players Win Twice
I heard that some SUSTCers are really good at playing Touhou Project (東方project) Games. As a kind of STG game, Touhou Project is very difficult and not friendly for beginners.
Some one sent me this game and challenged me: if you can pass all 6 levels in Lunatic difficulty, you can have the flag.

Each time you finish a level in Lunatic difficulty, one part of flag is given to flag.txt under the game directory. I have several ideas for you to break this game:
- As a real touhou player, you can play this game until you finish all levels.
- As a reverse engineer, you may observe the assembly codes and find how flag is given after each level.
- As a game trainer developer, you also can write a cheat for this game.
- As a social engineer, you can convince CS315's professor and TAs to tell you the flag.
Good luck!
https://mega.nz/file/KtNkiZga#juXA-LhgguC8De76CTYnHjPaObvlNcyjyEDXjhkSDCs
(2 pt) javaisez3
3rd round of your local Java rev! Note: This requires Java 11 and above to run.